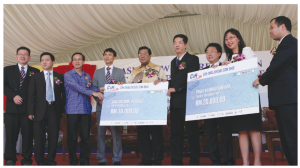
 Despite much initial scare-mongering from BN that Selangor will stall economically under opposition control, the reverse has taken place. Selangor’s preeminent position as the top investment centre in the country remains intact and even enhanced.
During the four years period since PR took over, Selangor has topped the nation in several categories. Cumulatively over four years, the state scored the highest amount of manufacturing investments (RM 38 billion), number of industrial projects (1168 projects) and manufacturing jobs created (100348 jobs).
Pakatan’s efforts at creating a cleaner, more transparent and consultative government has clearly paid off. One of the new initiatives taken by the state government to improve the investment process was to establish Industrial Park Management Committee (IPMC) and Industrial Park Management Group (IPMG) in all local councils and industrial zones.
According to Teresa Kok, state EXCO for investments, industrialisation and commerce, under the IPMC, the LCs will gather the local Federation of Malaysian Manufacturers (FMM) representatives and the infrastructural providers (e.g. water, electricity, telecommunication etc) monthly to resolve the manufacturers’ grouses.
‘This has helped to address the investors’ concerns and create an investment-friendly climate in Selangor.’ Much of these changes were the fruit of consultation with the stakeholders, the manufacturing community.
Assuredly PR’s sterling performance in attracting and retaining investments speaks a clear message – we can do a better job.
| Total Amount of Manufacturing Investment Approved
And Jobs Created by Top 8 State From 2008 to 2011 |
||||||
| State | 2008 | 2009 | 2010 | 2011 | Investment Received (RM Mil) |
Jobs Created |
| Selangor | 11,870.9 | 6,759.60 | 10,641.8 | 8,741.1 | 38,013.4 | 100,348 |
| Sarawak | 15,168.9 | 8,450.80 | 3,945.0 | 8,453.4 | 36,018.1 | 66,822 |
| Penang | 10,156.3 | 2,165.20 | 12,238.0 | 9,106.0 | 33,665.5 | 25,689 |
| Johor | 11,711.7 | 4,063.40 | 7,465.0 | 6,584.6 | 29,824.7 | 68,387 |
| Kedah | 2,567.3 | 1,496.00 | 1,960.6 | 6,136.0 | 12,159.9 | 20,464 |
| Melaka | 3,634.5 | 892.70 | 1,631.1 | 4,363.7 | 10,522.0 | 21,539 |
| Sabah | 964.4 | 5,664.30 | 1,325.6 | 921.4 | 8,875.7 | 10,882 |
| Perak | 3,130.0 | 893.90 | 3,039.7 | 984.9 | 8,048.5 | 17,597 |
| Source : MIDA , SSIC | ||||||


